
If you've visited my Fractals #1: the Cantor and Mandelbrot Sets page, you'll know how, in August 1985, an article in Scientific American's "Computer Recreations" column by A. K. Dewdney presented the Mandelbrot set to a large public audience for the first time.
That article was followed by several more on the subject of fractals over
the next few years. The M-set (as Arthur C. Clarke calls it  ) was again featured on some of these occasions; but
other fractal types also made their appearance.
) was again featured on some of these occasions; but
other fractal types also made their appearance.
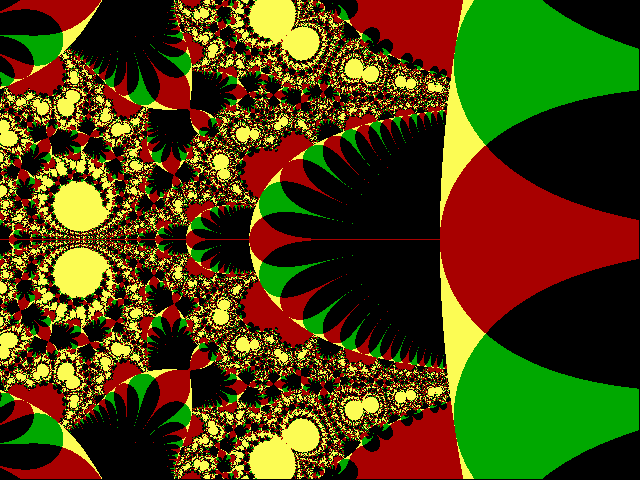
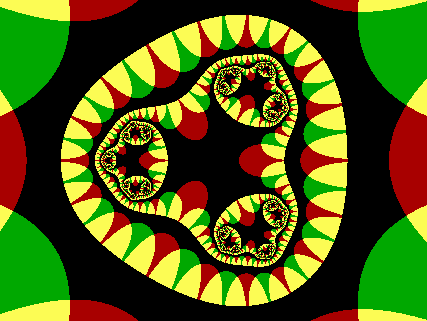
One in particular which caught my eye was presented in the July 1989 edition. Called "biomorphs", because of their similarity to certain types of living creatures, they are the discovery of Clifford A. Pickover (click here to visit his homepage; also have a look at this page).
According to the article, Dr. Pickover ran across these strangely biological-looking images by accident - they were the result of a bug (pun intended) in a program he was using to investigate something else! (Now there's a mathematician / scientist for you - take what ideas come your way, by whatever means, and check out their possibilities. You never know what you may find.)
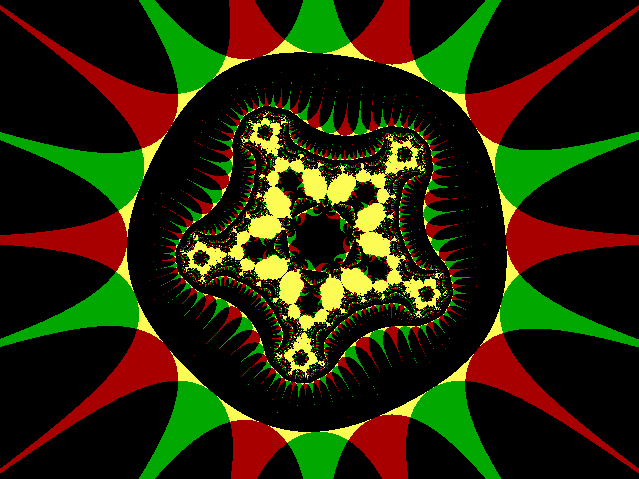
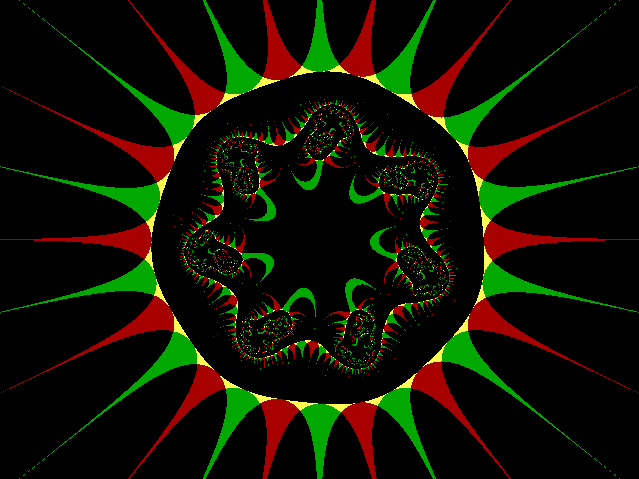
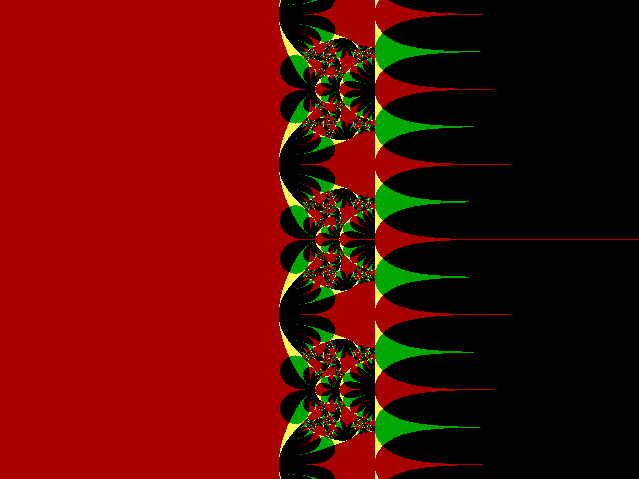
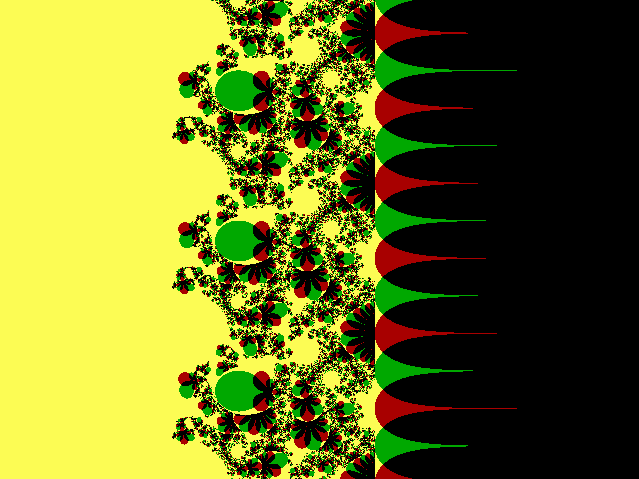
Here's a creature of the type he found:
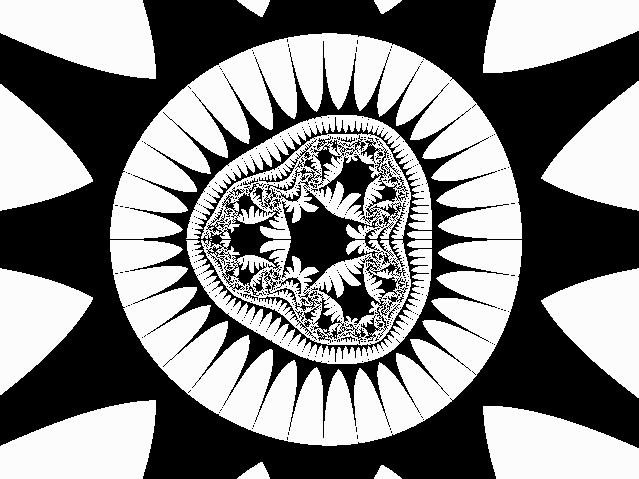
As you can see, it's like nothing you'll find in the Mandelbrot set! (You can click on it to see a 639×479 version.)
Clifford Pickover calls a biomorph of this type, with spikes radiating from
an essentially circular centre with a symmetrical pattern inside, a
radiolarian, because of its similarity to an aquatic creature by that
name. Such patterns are generated by iterating a power of a complex number
z, which is equal to x+yi (where i2 =
-1).
The example above is generated by the cube of x+yi, which expands as
follows:
z3 =
(x+yi)3 =
(x3 -
3xy2) +
(3x2y -
y3)i
Here's the DOS BASIC program I used to generate the above image:
REM ***** RADIOLARIAN - BLACK & WHITE *****
constreal = .5
screenheight = 321
aspectratio = screenwidth / screenheight: REM approx. 4/3
black = 0
SCREEN 12: CLS : REM graphics screen, 640x480 pixels, 16 colours
ymax = 2.5
ilimit = screenheight - 1
FOR i = 0 TO ilimit
a$ = ""
You can right-click
here
to download this BASIC program, bio_b&w.bas, to your hard disc.
You may have noticed four lines, in two pairs, in the above program
highlighted in blue.
The blue lines in the second pair:
xx = x * (x * x - 3 * y * y) + constreal: REM this line and the next give the cube
determine the complex function which determines the overall shape of the
image.
The blue lines in the first pair:
constreal = .5
refer to the real and imaginary components of a constant complex number
which is added at each iteration. Changing either or both of these makes a
difference to the resulting image. Try it!
You may also have noticed two magenta lines near the top of the program:
screenheight = 321
These determine the actual size of the image. You can put whatever values
you like in here; I've chosen them in my examples to give an aspect ratio of
approximately 4:3, but you don't have to.
Also, notice that they're both odd numbers. Making them odd allows the axes
(or part thereof) to appear (if they "want to"). If you make them even, the
axes won't appear (whether they "want to" or not
Sometimes it may be desirable to have the axes visible; sometimes it may
not. You can decide this for a particular image. Note, however, that if you
make one or both of these values even, so that the axis doesn't show, you'll
find instead that whatever small part of the axis does appear anyway is two
pixels wide and perhaps looks even worse than an unwanted single-thickness
axis.
Also note, in this connection, that the figures given for the x-range in the
examples to follow are all based on a 429×321 layout. (This differs slightly
from the 639×479 case.)
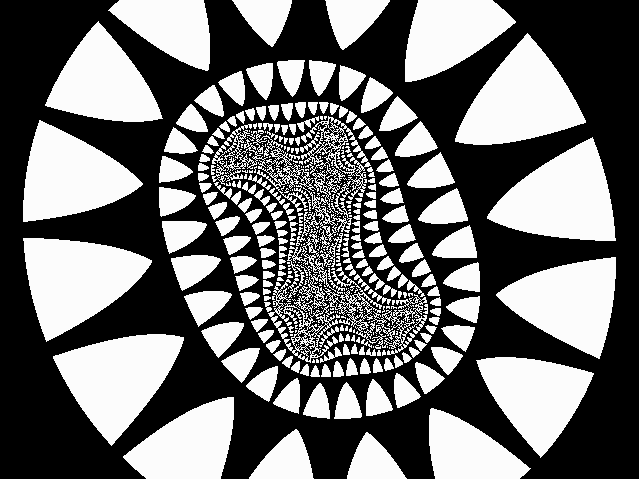
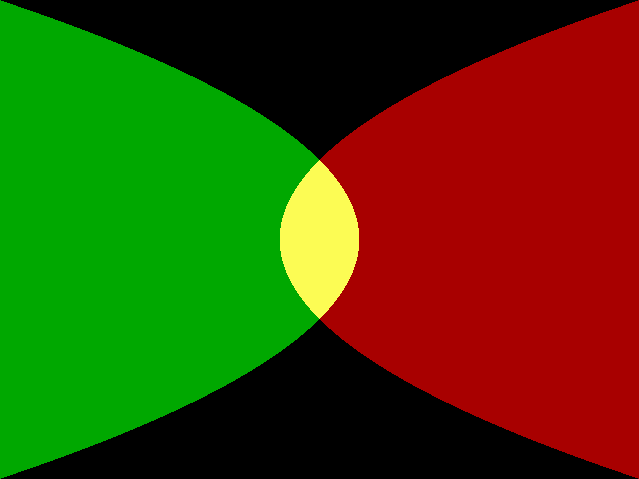
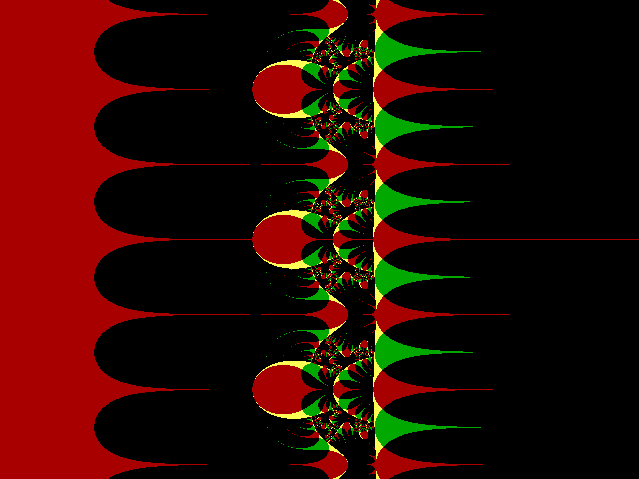
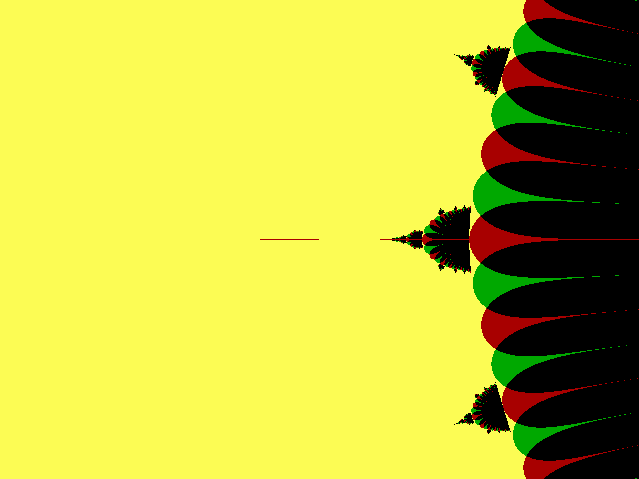
The following image is produced by the above program, with the following
alterations:
xx = x * x - y * y + constreal: REM this line and the next give the square
and:
constreal = .4
(Again, you can click on it to see a 639×479 version.)
I'll present some more examples - some with quite different shapes -
shortly; but first, a bit more background on the topic, and then I'll
present what I believe may be my own original "variation on the theme".
Quite unlike the M-set, once the process exits the loop, the way a point is
represented (black or white) is determined by the size of the real and
imaginary parts of the value at exit.
The iterative loop is set to operate a set maximum number of times for each
pixel. I set this to 100 iterations (maximum) in my version, although
Dewdney's version only went to a maximum of 10 iterations. If the number is
too small, you lose detail. 10 is probably OK, but I'm playing safe.
(With the M-set, it's usual to go to 1,000 or more iterations. I suspect
that this is quite unnecessary with biomorphs.)
The condition for exiting the loop before the maximum is reached is that the
modulus of the iterated number is greater than 10, or that the magnitude of
either the real or imaginary part is greater than 10. Then, if the magnitude
of either the real or imaginary part is less than 10, the pixel is coloured
black - otherwise, it's coloured white.
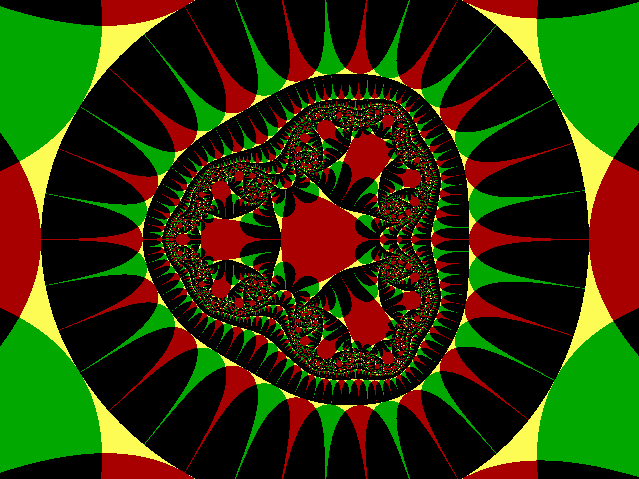
This brings me to my own "variation on the theme", mentioned above.
The condition for setting the colour of each plotted pixel in the program
is contained in the lines shown in orange:
IF ABS(x) < 10 OR ABS(y) < 10 THEN
Now, that condition is actually two conditions in one. This led me to
think that there are actually four possibilities, which means that we
can have four colours in the resulting image.
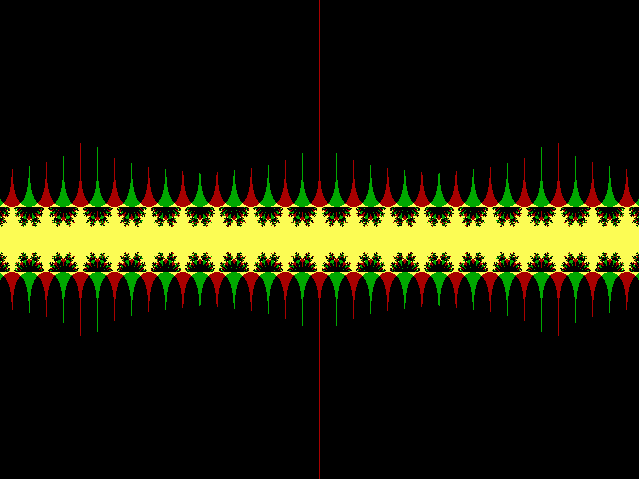
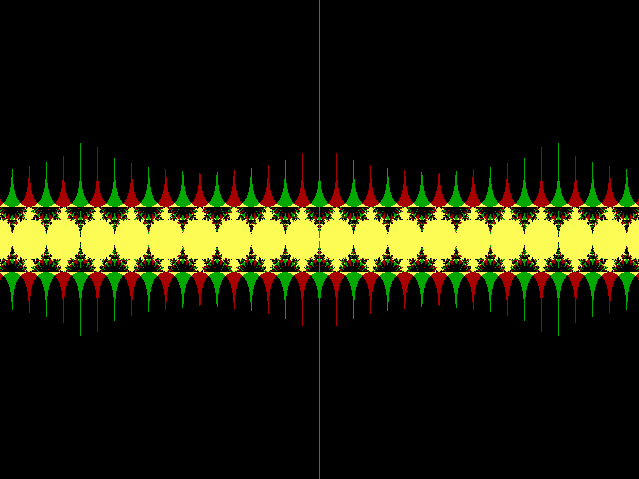
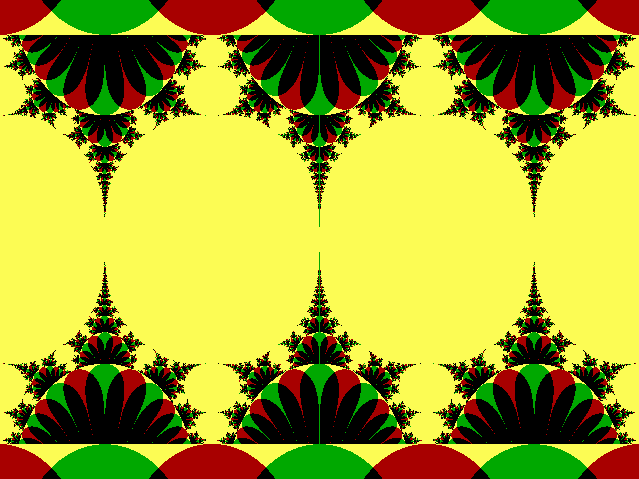
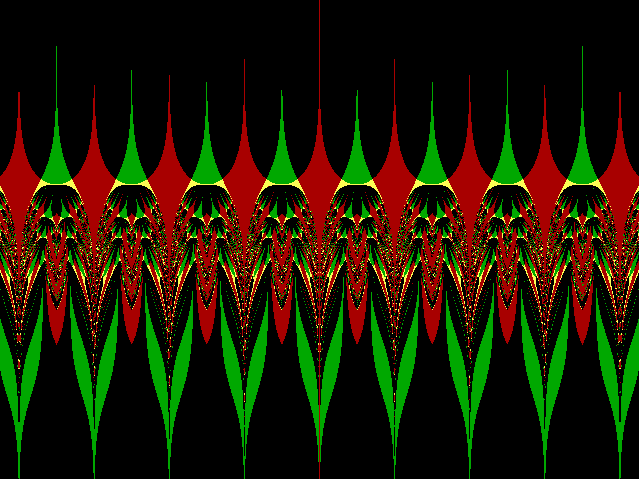
So I decided to use red, green, yellow, and black as follows:
If ABS(x) < 10 and ABS(y) < 10, plot yellow;
Right-click
here
to download the modified BASIC program, bio_colr.bas, to your hard disc. (You
can use this as a basis for all the other biomorphs in this page, as well as
for any further investigations you may like to undertake yourself.)
Function: z3
Additive constant
The x and y ranges are given to five significant figures.
The additive constant consists of two parts: the real part (0.5 in this
case), and the imaginary part (0 in this case). As already mentioned, these
appear in the program as constreal
and constimag respectively.
The "Application" of the constant may be either Type 1 or Type 2. All three
examples given so far are of Type 1. This means that the constant is added
to the function directly. With Type 2, the constant is not
added directly, but is added in the next step, so as to affect the
updated values of x and y for the next iteration without affecting the
function's current value.
Thus in the last example above (Type 1), the program contains the following four
lines:
xx = x * (x * x - 3 * y * y) + constreal
- whereas if it were decided to run a Type 2 process instead, those four
lines would read:
xx = x * (x * x - 3 * y * y)
The difference is somewhat akin to the difference (in programming terms)
between passing by reference and passing by value. It may be
subtle; but the effect on the resulting image may be profound.
I discovered this trick by experiment. Sometimes, if a Type 1 program's
output looked a bit boring, I found I could spice it up by adding the
constant in a different position - i.e. making it into a Type 2 program.
(The sketch version given originally by Dewdney can be interpreted either
way, but was probably intended to be of Type 1.) You may like to experiment
with this yourself.
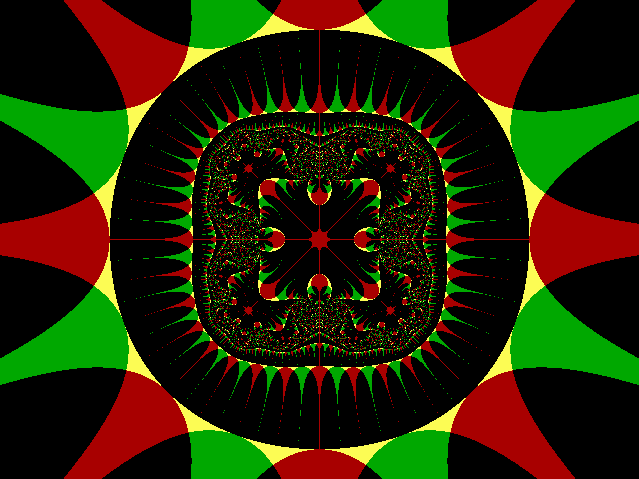
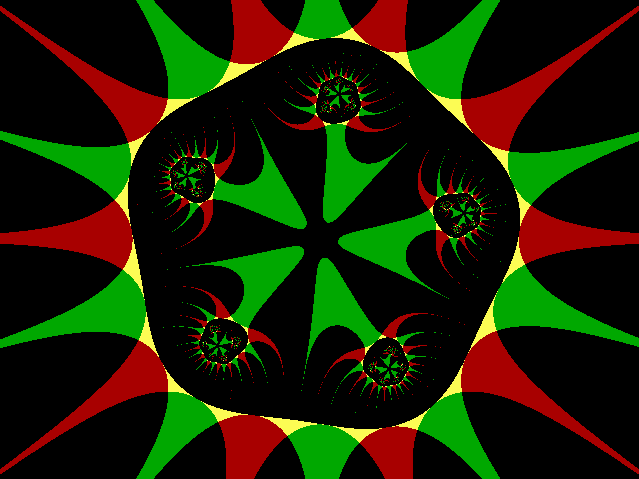
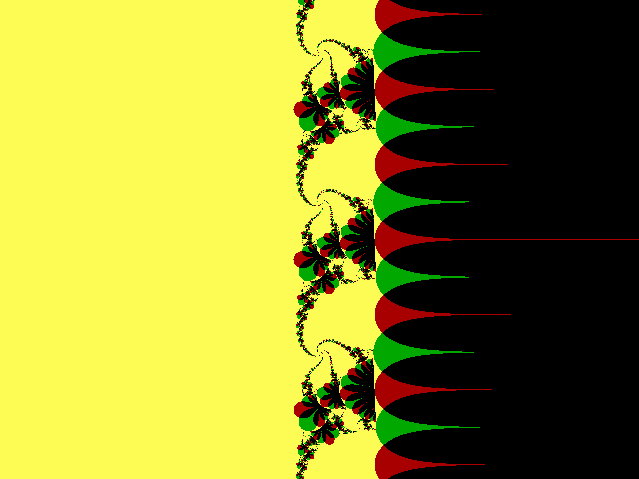
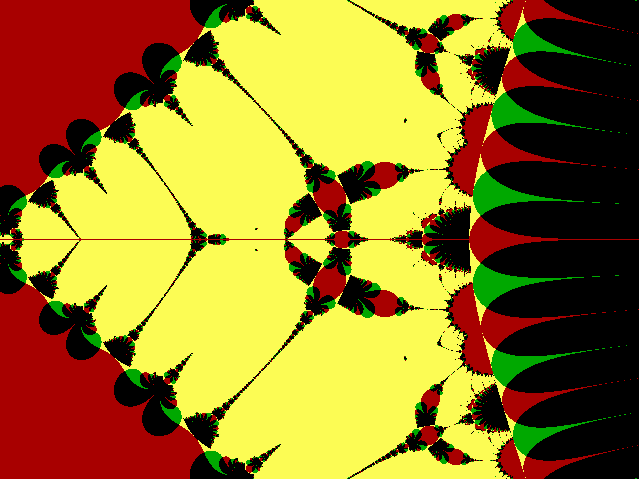
Function: z4
Additive constant
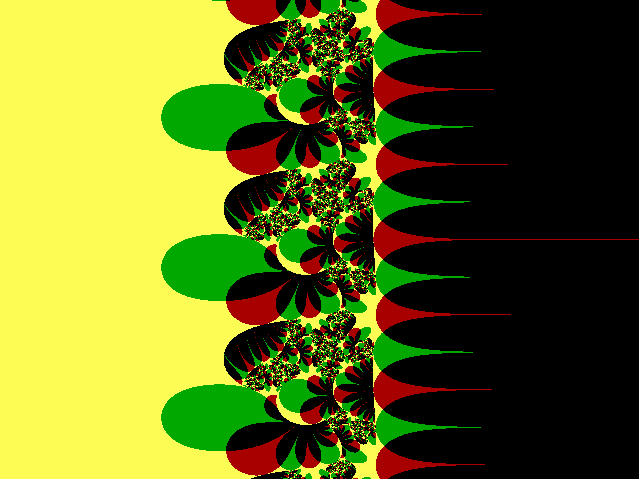
The next one is based on
z5 =
(x+yi)5 =
x5 -
10x3y2 +
5xy4 +
(5x4y -
10x2y3 +
y5) i .
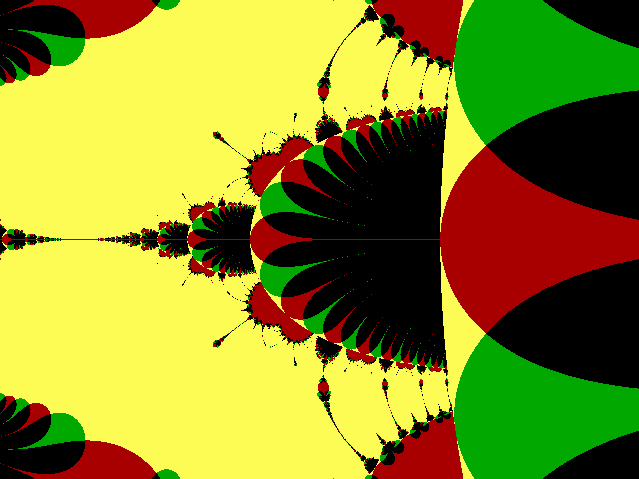
Function: z5
Additive constant
(x-yi)5 =
x5 -
10x3y2 +
5xy4 -
(5x4y -
10x2y3 +
y5) i :
Function: [conj(z)]5
Additive constant
Function: [conj(z)]5
Additive constant
= x7 -
21x5y2 +
35x3y4 -
7xy6 +
(7x6y -
35x4y3 +
21x2y5 -
y7) i :
Function: z7
Additive constant
Function: z7
Additive constant
For a start, let's change the positive to negative. What simpler way to do
so than to investigate what happens with a power of -1, i.e. to consider
the reciprocal of a complex number?
If z = x+yi, then 1/z =
(x-yi)/(x2+y2).
Quite a surprise - the following very simple biomorph, based on the
reciprocal function, is nothing like a radiolarian at all!
Function: 1/z = z -1
Additive constant
UPDATE, Wednesday, 2nd July 2014
I've just found something which quite possibly throws a considerable amount of
light on the above graphic. Have a look at this link, about halfway down the page:
http://en.citizendium.org/wiki/taylor_series
I may return to some of the issues surrounding this in a future web-page - stay tuned...
(This is one of the really wonderful things about mathematics: there's always something else to learn!)
Another variation to the radiolarian format involves having something other
than an integer for the power. Again keeping it simple, we'll try with a
power of 0.5, i.e. the square root of z :
The "principal value" of the square root of x+yi is
{sqrt[sqrt(x2+y2) + x] +
sqrt[sqrt(x2+y2) - x] × sgn(y)
i} / sqrt(2)
where "sqrt" means square root of and "sgn" means sign of,
i.e. ±1 or 0, depending on whether the number is positive, negative, or
zero. (See
this page
- about a third of the way down - for a derivation of this square root
formula.)
Here's the result:
Function: z˝
Additive constant
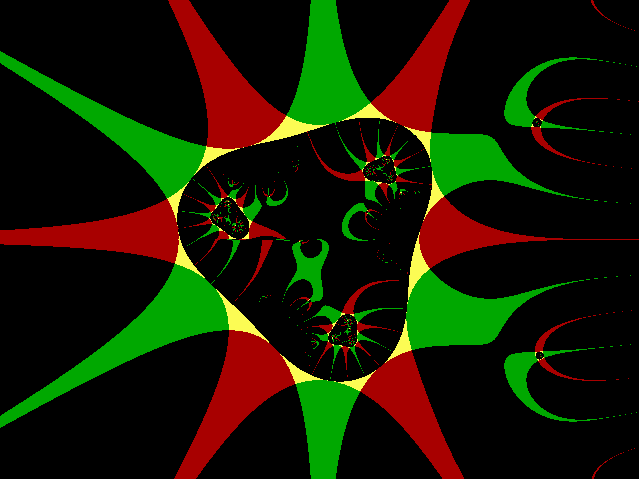
Before moving on to more obviously "fractal"-looking biomorphs, here's one
more somewhat similar to the last two - although, this time, there quite
clearly is some "self-similar" behaviour occurring. For the first time, the
function is not a standard form, but rather a concoction, just to see what
happens:
Function:
Additive constant
Have a careful look at the main structures in the graphic, and try to relate
them to the function. Then modify the program to operate on the function
x2-y + (xy+4) i
with ymax set to 12 and the constant set to zero (Type 2), and see what
happens. (I suspect that a whole line of research could open up here...)
So far, the functions have all been algebraic. Now let's have a look
at some transcendental functions, starting with basic trigonometric
functions. Here's the expansion for cos(z) :
cos(z) = cos(x)cosh(y) - sin(x)sinh(y) i
= cos(x)(ey+e-y)/2
- sin(x)(ey-e-y)/2 i
- and here's its biomorph:
Function:
Additive constant
Similarly, sin(z):
sin(z) = sin(x)cosh(y) + cos(x)sinh(y) i
= sin(x)(ey+e-y)/2
+ cos(x)(ey-e-y)/2 i
- and the biomorph:
Function:
Additive constant
Function:
Additive constant
Now here's a "trigonometrical doodle" function:
ey[1/|tan(x)| + |sin(x)| i]
Two things to note here: firstly, the straight brackets, | |, are "mod" or
absolute value brackets [the corresponding BASIC function is
ABS(...)]; secondly, tan(0) = 0, which means that we're effectively dividing
by zero when x = 0 (or any multiple of pi) - so that a programming trick is
required to avoid a crash. I just added a very small number,
10-15, to the tan(x). Quick and dirty -
but it worked fine! (You'll find more examples of this kind of thing in
later examples.)
Function:
Additive constant
ez =
ex[cos(y) + sin(y) i]
- which is sometimes written as
excis(y), where "cis" means
"cos + i sin".
With different values of the constant, this provides some very attractive
variations, as follows:
Function:
Additive constant
Function:
Additive constant
Function:
Additive constant
Function:
Additive constant
ex[sin(y-pi/4) + sin(y+pi/4) i]
or, equivalently,
ex[cos(3pi/4-y) + sin(3pi/4-y) i]
is shown here:
Function:
Additive constant
Just a thought: if you rotate this 90ş clockwise, it may spook you out a
bit!
This function can be expressed as
ez ln(z) =
e(x+yi)ln(x+yi), and then coded into a
programming algorithm by proceeding as follows:
logreal = ln[sqrt(x2+y2)]
Couldn't be simpler, could it?
Function:
Additive constant
Function:
Additive constant
ymax = 1
- all as usual so far; but then:
- so that the graphic is centred on (2.0047,0).
Function:
Additive constant
Function:
Additive constant
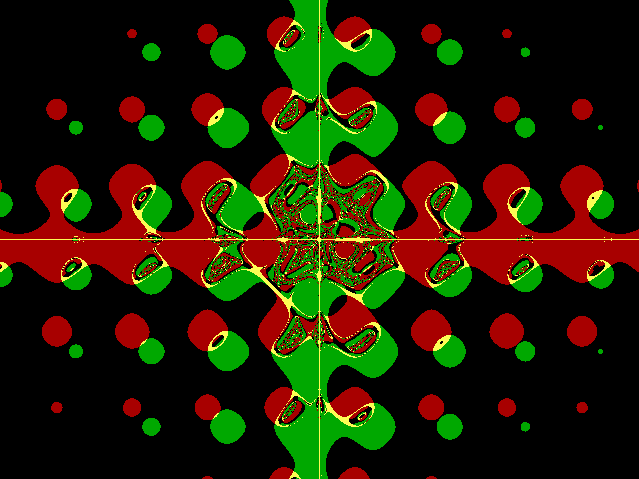
First: something that looks like a Moiré pattern. The function is:
ex ln[10-9 +
|cos(x+y2)|] +
ey ln[10-9 +
|sin(x2+y)|] i
Function:
Additive constant
esin(x)+cos(y)
sqrt|x2y| +
ecos(x)+sin(y)
sqrt|xy2| i
Function:
Additive constant
Function:
Additive constant
Actually, I haven't even covered all the "elementary" functions here; for
example, the hyperbolic functions cosh(z) and sinh(z) are conspicuous by
their absence other than as parts of the expansions into real and imaginary parts of
cos(z) and sin(z) - see above. Their own expansions are, respectively:
cosh(z) = cosh(x+yi) = cosh(x)cos(y) + sinh(x)sin(y) i
and
sinh(z) = sinh(x+yi) = sinh(x)cos(y) + cosh(x)sin(y) i
Then, of course, there is tanh(z), which is equal to sinh(z)/cosh(z).
No doubt there are also ways to incorporate any or all of these into hybrid
functions which may generate further interesting biomorphs.
And then there are logarithms, the trigonometric and hyperbolic inverses,
and perhaps odd things like the
Gamma function...
The sky's the limit!
UPDATE, Thursday, 18th May 2017
This page is well overdue for an update!
The fact is, that last link stopped "working" quite some time ago, which is a pity,
because it was a really delightful page (and even though I've searched long and hard
to find it elsewhere, I haven't been successful). The reason I'm finally addressing
the matter now, at long last, is that I've been going through some old emails, one
of which was from someone a while back which drew my attention to another
web-page which has some rather neat biomorph graphics on it. So, without further ado,
may I invite you to have a look at this page:
http://www.apeirography.com/en/projects/biomorphs/
- and then check out the following page also, which features a larger version of one
of those biomorphs along with a thought-provoking poem about the nature of mathematics
in general, and fractals in particular:
The excellent freeware fractal program
FRACTINT
handles biomorphs mainly in this way. You can produce a Mandelbrot set
image, for example, with the biomorph option switched on. This will produce
the characteristic spiky shapes evident in many of the graphics above within
the contours of the resulting image.
Fair enough - but there's so much that you can do with biomorphs in their
own right, without reference to other fractals - as in Pickover's own
original vision - that it surprises me that they're not better known.
Perhaps this page can help redress the balance.
Below, in place of my usual "Mad Teddy" lightbulb logos, you will see two
copies of an animation generated by z3.
It's a smaller (87×87 pixels), modified version of the first coloured
biomorph presented near the top of this page: the constant (of modulus 0.5)
changes in each of the 40 frames so that its argument progresses
anticlockwise around the Argand plane by 3 degrees each time, starting from
0.5+0i in the first frame; in the line containing 10, 10, and 10^2, these
are replaced by 5, 5, and 5^2; and black and yellow are interchanged.
(Application is of Type 1.)
If you'd like to see a 427×321 version with 120 frames (1.2 Mb), click
here.
My home page
Preliminaries (Copyright, Safety)
constimag = 0
screenwidth = 429
white = 15
ymin = -ymax
xmax = ymax * aspectratio
xmin = -xmax
jlimit = screenwidth - 1
FOR j = 0 TO jlimit
x0 = xmin + (xmax - xmin) * j / jlimit
y0 = -ymin - (ymax - ymin) * i / ilimit
x = x0
y = y0
FOR n = 1 TO 100
xx = x * (x * x - 3 * y * y) + constreal: REM this line and the next give the cube
yy = y * (3 * x * x - y * y) + constimag: REM of the number, plus a constant
x = xx
y = yy
IF ABS(x) > 10 OR ABS(y) > 10 OR x * x + y * y > 10 ^ 2 THEN
n = 100
END IF
NEXT n
IF ABS(x) < 10 OR ABS(y) < 10 THEN
PSET (j, i), black
ELSE
PSET (j, i), white
END IF
NEXT j
NEXT i
DO
a$ = INKEY$
LOOP UNTIL a$ = CHR$(27): REM wait until Esc is pressed to end the program
yy = y * (3 * x * x - y * y) + constimag: REM of the number, plus a constant
constimag = 0
screenwidth = 429
) -
although short lengths of axis may still appear after all.

yy = 2 * x * y + constimag: REM of the number, plus a constant
constimag = .7
PSET (j, i), black
ELSE
PSET (j, i), white
END IF
If ABS(x) >= 10 and ABS(y) < 10, plot red;
If ABS(x) < 10 and ABS(y) >= 10, plot green; and
If ABS(x) >= 10 and ABS(y) >= 10, plot black.
 x: -2.5125 to 2.5125
y: -1.88 to 1.88
= (x3 -
3xy2)
+ (3x2y -
y3) i
= 0.5 + 0 i
Application:
Type 1
yy = y * (3 * x * x - y * y) + constimag
x = xx
y = yy
yy = y * (3 * x * x - y * y)
x = xx + constreal
y = yy + comstimag
 x: -2.6729 to 2.6729
y: -2 to 2
= (x4 -
6x2y2
+ y4)
+ 4xy(x2 -
y2) i
= 0.5 + 0 i
Application:
Type 2
 x: -2.6729 to 2.6729
y: -2 to 2
= 0.75669 (1 + i)
chosen to give
exactly the effect I
wanted)
Application:
Type 2
 x: -3.0070 to 3.0070
y: -2.25 to 2.25
= 1 + i
Type 2
 x: -3.0070 to 3.0070
y: -2.25 to 2.25
= -15888 + 0i
Type 2
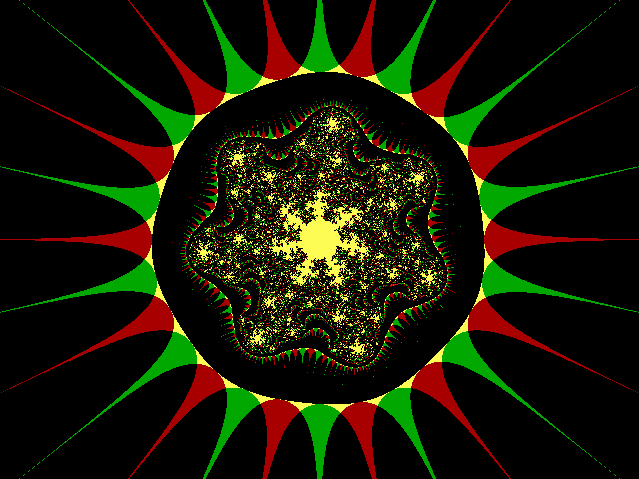 x: -2.6729 to 2.6729
y: -2 to 2
= 0.60595(1 + i)
Type 2
 x: -2.6729 to 2.6729
y: -2 to 2
= 0.7568(1+i)
Type 2
 x: -0.1336 to 0.1336
y: -0.1 to 0.1
= 0 + 0i
Application:
(Type 2)
 x: -133.64 to 133.64
y: -100 to 100
= sqrt(z)
= 0+0i
Application:
(Type 2)
 x: -14.701 to 14.701
y: -11 to 11
x+y2 +
(x2+y) i
= 0+0i
Application:
(Type 2)
 x: -29.402 to 29.402
y: -22 to 22
cos(z)
= 0+0i
Application:
(Type 2)
 x: -29.402 to 29.402
y: -22 to 22
sin(z)
= 0+0i
Application:
(Type 2)
 x: -4.6776 to 4.6776
y: -3.5 to 3.5
sin(z)
= 0+0i
Application:
(Type 2)
 x: -13.364 to 13.364
y: -10 to 10
ey[1/|tan(x)|
+ |sin(x)| i]
= 0.5+0i
Application:
Type 2
 x: -2.5125 to 2.5125
y: -1.88 to 1.88
ez
= 0+0i
Application:
(Type 2)
 x: -2.5125 to 2.5125
y: -1.88 to 1.88
ez
= 0.05+0i
Application:
Type 2
 x: -2.5125 to 2.5125
y: -1.88 to 1.88
ez
= 0+0.5i
Application:
Type 2
 x: -2.5125 to 2.5125
y: -1.88 to 1.88
ez
= 0.5+0.5i
Application:
Type 2
 x: -13.364 to 13.364
y: -10 to 10
excis(3pi/4-y)
= 0+0i
Application:
(Type 2)

logimag = arctan(y/x)
if x<0 and y>0 then add pi to logimag
if x<0 and y<0 then subtract pi from logimag
indexreal = x×logreal - y×logimag
indeximag = x×logimag + y×logreal
function = eindexreal[cos(indeximag)
+ sin(indeximag) i]

 x: -5.3458 to 5.3458
y: -4 to 4
zz
= 0+0i
Application:
(Type 1)
 x: -5.3458 to 5.3458
y: -4 to 4
zz
= 0.001+0i
Application:
Type 1
ymin = -ymax
xmax = ymax * aspectratio
xmin = -xmax
xmax = xmax * 2.5
 x: 0.6682 to 3.3411
y: -1 to 1
zz
= 0.001+0i
Application:
Type 1
of John Wyndham's
"Day of the Triffids"!
 x: 0.6682 to 3.3411
y: -1 to 1
zz
= 0.01+0i
Application:
Type 1
 x: -13.364 to 13.364
y: -10 to 10
(as given above)
= 0.5+0i
Application:
Type 2
 x: -26.729 to 26.729
y: -20 to 20
(as given above)
= 0.5+0i
Application:
Type 2
 x: -5.3458 to 5.3458
y: -4 to 4
zz +
z3
= 3-3i
Application:
Type 1
 Return to Computer Graphics sub-menu